Load test run on November 13, 2026, against the production API.
The short version:
deepseek-v4.1-flashhandled 5,000 requests per minute with a 100% success rate. The median time to first token was 1.36 seconds, and 95% of requests saw their first token within 1.97 seconds. That is more than 1.2 million tokens per minute.deepseek-v4-prohandled 2,500 requests per minute with a 100% success rate. The median time to first token was 2.15 seconds, and p95 was 2.82 seconds.- Latency did not creep up with load. From 500 RPM to the stable limit, time to first token stayed essentially flat.
- Both models cost less than the official DeepSeek API: up to 60% off.
Results at a Glance
We call a load level stable when at least 99% of requests succeed and the p95 time to first token is 5 seconds or less. The table shows each model at its highest stable level.
| Model | Stable load | Success rate | Time to first token (p50) | Time to first token (p95) | Output speed (p50) | Token throughput |
|---|---|---|---|---|---|---|
deepseek-v4.1-flash |
5,000 RPM | 100% | 1.36 s | 1.97 s | 71 tokens/s | 1,213,475 TPM |
deepseek-v4-pro |
2,500 RPM | 100% | 2.15 s | 2.82 s | 41 tokens/s | 617,122 TPM |
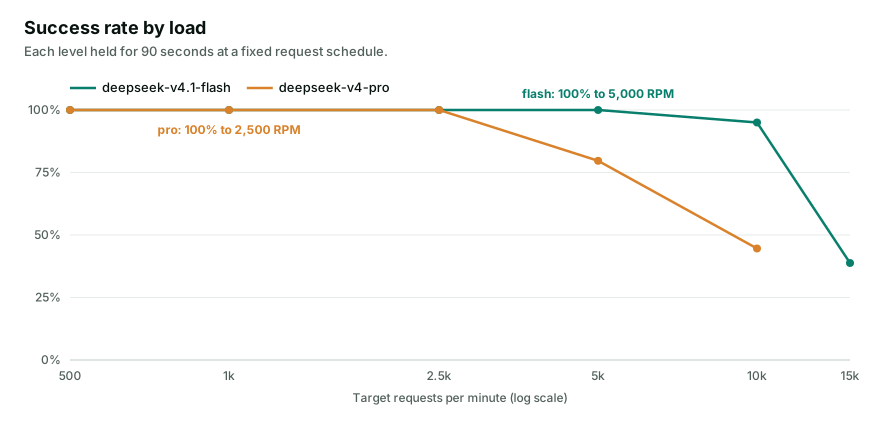
Every request succeeded at every level up to these limits: 500, 1,000, and 2,500 RPM for both models, plus 5,000 RPM for flash.
Latency Stays Flat as Load Grows
A stable rate means little if users wait longer at that rate. So we tracked time to first token at every step.
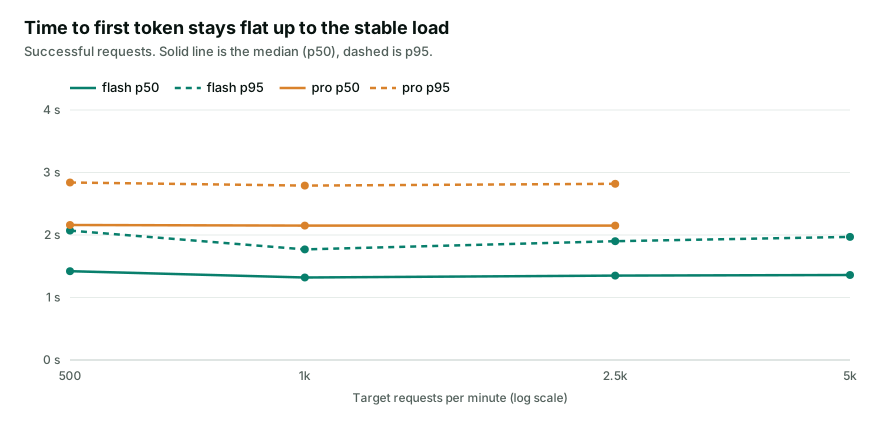
For flash, the median moved between 1.32 and 1.42 seconds across the whole range, and the p95 never went above 2.07 seconds. For pro, the median stayed between 2.15 and 2.16 seconds, and the p95 between 2.79 and 2.84 seconds. Going from 500 to 5,000 RPM, a tenfold increase, did not make the first token arrive any later.
Complete responses were fast too. At the stable load, 95% of flash streams finished within 4.2 seconds, and 95% of pro streams within 6.8 seconds.
| Model | Target RPM | Success rate | TTFT p50 | TTFT p95 | TTFT p99 | Output speed (p50) | Total latency (p95) |
|---|---|---|---|---|---|---|---|
deepseek-v4.1-flash |
500 | 100% | 1.42 s | 2.07 s | 2.94 s | 74 tokens/s | 4.31 s |
deepseek-v4.1-flash |
1,000 | 100% | 1.32 s | 1.77 s | 2.24 s | 73 tokens/s | 3.96 s |
deepseek-v4.1-flash |
2,500 | 100% | 1.35 s | 1.90 s | 2.38 s | 71 tokens/s | 4.07 s |
deepseek-v4.1-flash |
5,000 | 100% | 1.36 s | 1.97 s | 2.58 s | 71 tokens/s | 4.17 s |
deepseek-v4-pro |
500 | 100% | 2.16 s | 2.84 s | 3.57 s | 43 tokens/s | 6.67 s |
deepseek-v4-pro |
1,000 | 100% | 2.15 s | 2.79 s | 3.29 s | 43 tokens/s | 6.54 s |
deepseek-v4-pro |
2,500 | 100% | 2.15 s | 2.82 s | 3.35 s | 41 tokens/s | 6.79 s |
Pushing Past the Limit
Once we had the stable numbers, we kept raising the load to find where each model tops out.
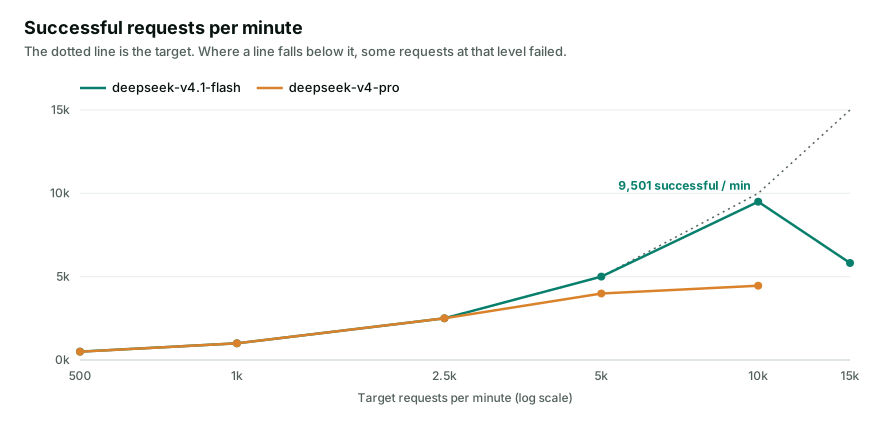
At 10,000 RPM, flash still completed 95% of requests, or 9,501 successful requests per minute. Pro peaked at about 4,450 successful requests per minute. Above those points, success rates dropped quickly.
What matters for your application is how the overload showed up. Requests that could not be served were rejected with a standard HTTP error and a stable error code, instead of hanging until the client timed out. Your code can see the rejection, back off, and retry, instead of holding open connections that will never complete.
How It Compares With Providers on OpenRouter
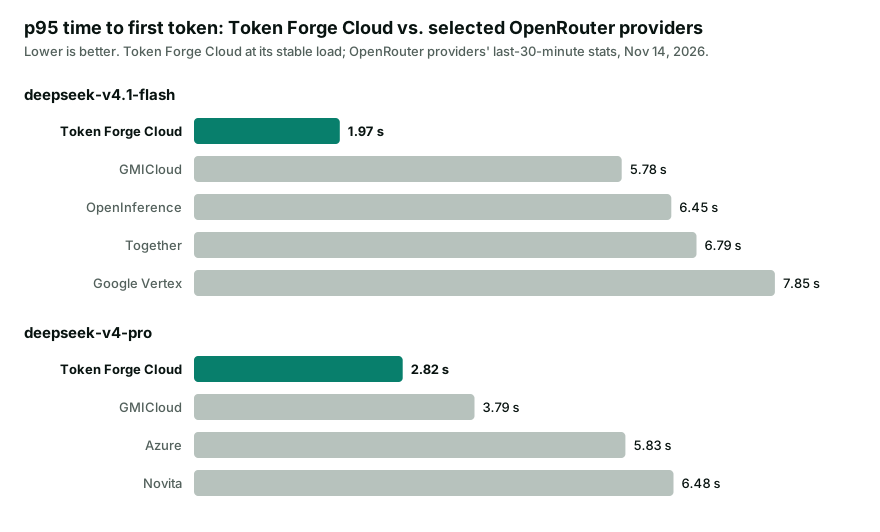
OpenRouter publishes live latency statistics for every provider that serves a model. Here is our p95 time to first token next to several of them.
| Model | Provider | Time to first token (p95) | Throughput (p50) | Uptime |
|---|---|---|---|---|
deepseek-v4.1-flash |
Token Forge Cloud | 1.97 s | 71 tok/s | 100% |
| GMICloud | 5.78 s | 43 tok/s | 100% | |
| OpenInference | 6.45 s | 149 tok/s | 100% | |
| Together | 6.79 s | 255 tok/s | 100% | |
| Google Vertex | 7.85 s | 61 tok/s | 99.79% | |
deepseek-v4-pro |
Token Forge Cloud | 2.82 s | 41 tok/s | 100% |
| GMICloud | 3.79 s | 26 tok/s | 99.93% | |
| Azure | 5.83 s | 78 tok/s | 100% | |
| Novita | 6.48 s | 50 tok/s | 100% |
The tail is where users notice slowness: one request in twenty is slower than the p95. On flash, our p95 is between a quarter and a third of the providers shown here. On pro, it is 26% to 56% lower.
About this comparison: the OpenRouter latency and throughput figures are each provider's p95 latency and median throughput over the 30 minutes before we read them on openrouter.ai on November 14, 2026. Uptime is OpenRouter's last-24-hour figure. OpenRouter measures real traffic with prompts of many lengths. Our figure comes from the controlled test described below, at the stable load. The conditions differ, so treat this as a directional comparison.
How We Ran the Test
Same path as your code. Every request used a standard API key and went to the production https://api.tokenforgecloud.com/v1/chat/completions endpoint with stream: true. There was no private endpoint and no special routing. The test account's rate limit was raised to 20,000 RPM and 5,000 concurrent requests so that it would not cap the measurement. If your workload needs limits above the default, contact us.
Client. A 16-core VM in Azure's US West 2 region, running 12–14 sending processes.
Fixed schedule. Each request was sent at a pre-scheduled time, regardless of whether earlier requests had returned. This keeps the offered load constant even when responses slow down, which is how real traffic behaves. The client's own scheduling delay stayed below 10 ms at p99. We also verified that the client could generate the target load: an earlier attempt from a container service with shared outbound IPs could not open connections fast enough above 5,000 RPM, so we discarded that data.
No cache shortcuts. Every prompt was unique, about 100 input tokens, so no response could come from a prompt cache. max_tokens was 200, average output was about 140 tokens, and reasoning was off.
Load steps. 500, 1,000, 2,500, 5,000, 10,000, and 15,000 RPM, each held for 90 seconds. A series stopped after any step where half or more of the requests failed.
What we measured:
- Time to first token (TTFT): from sending the request to receiving the first content token. Only successful requests are counted.
- Output speed: output tokens per second after the first token.
- Total latency: from sending the request to the end of the stream.
- Token throughput (TPM): input plus output tokens of successful requests, per minute of sending time.
What These Results Cover
These numbers describe a specific workload, and we want you to know its limits:
- Short requests: about 100 tokens in and 140 tokens out. Long documents, long answers, and agent loops do more work per request, so expect fewer requests per minute for the same token volume.
- Reasoning off. With reasoning on, each request generates more tokens and takes longer.
- 90 seconds per step. These are step tests, not multi-hour runs.
- One account and one API key. This measures what a single customer can push through.
If your traffic looks different, the method above is easy to reproduce with your own prompts. Create an account and test it with your own workload.