Tested on November 15–16, 2026.
The short version:
tokenforge/glm-5.3handled 4,200 requests per minute with 2,099 of 2,100 requests succeeding. The median time to first token was 1.89 seconds and p95 was 5.62 seconds, at about 5.4 million tokens per minute.tokenforge/glm-5.3-flashhandled 2,400 requests per minute with a 100% success rate. The median time to first token was 2.01 seconds and p95 was 5.29 seconds, at about 3.0 million tokens per minute.- The median first token did not drift with load. Both models stayed near two seconds from the lightest step to their stable limit.
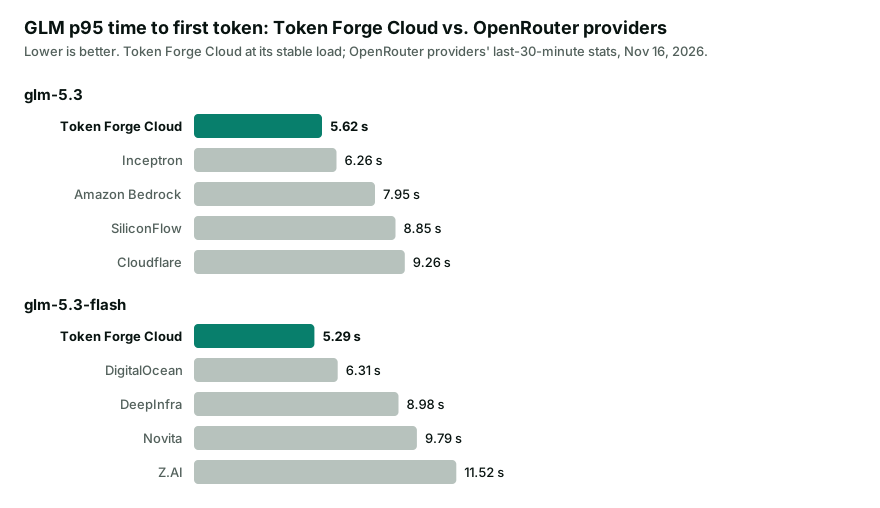
- Our p95 time to first token was 10% to 54% lower than the GLM providers we compared on OpenRouter, including Z.AI's own API for GLM 5.3 Flash.
- Priced up to 30% below Z.AI's list price.
Results at a Glance
We call a load level stable when at least 99% of requests succeed and the p95 time to first token is 8 seconds or less. GLM models always reason before they answer, and their p95 rises from about 2.5 seconds at light load to between 4 and 6.3 seconds from 1,200 RPM up, while the median stays near 2 seconds. For models that can turn reasoning off we use a 5-second bar; under that bar, GLM 5.3 would be stable at 1,200 RPM and GLM 5.3 Flash at 1,800 RPM.
| Model | Stable load | Success rate | Time to first token (p50) | Time to first token (p95) | Output speed (p50) | Token throughput |
|---|---|---|---|---|---|---|
tokenforge/glm-5.3 |
4,200 RPM | 99.95% | 1.89 s | 5.62 s | 73 tokens/s | ~5.4M TPM |
tokenforge/glm-5.3-flash |
2,400 RPM | 100% | 2.01 s | 5.29 s | 40 tokens/s | ~3.0M TPM |
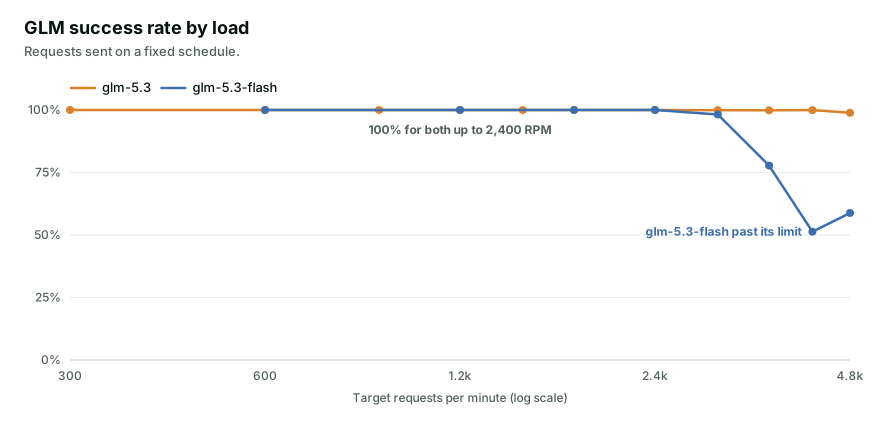
Up to 2,400 RPM, every request to both models succeeded. Above that, GLM 5.3 lost at most two requests per step to connection timeouts up to 4,200 RPM, and GLM 5.3 Flash reached its limit.
Latency Stays Flat as Load Grows
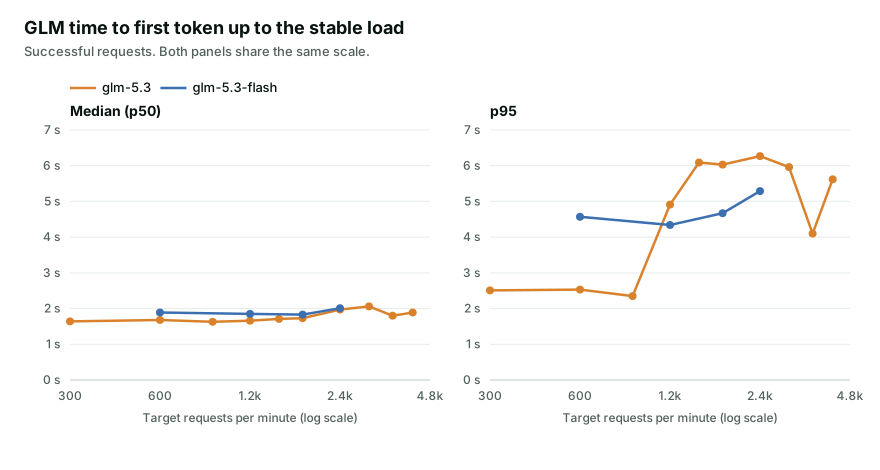
For GLM 5.3, the median stayed between 1.63 and 2.06 seconds across fourteen-fold growth, from 300 to 4,200 RPM. GLM 5.3 Flash's median stayed between 1.83 and 2.01 seconds up to 2,400 RPM. The p95 is less smooth: it moves between about 4 and 6.3 seconds once the load passes 1,200 RPM. If your product shows a spinner until the first token arrives, plan for that tail, not the median (why p95 matters more than the average).
| Model | Target RPM | Success rate | TTFT p50 | TTFT p95 | TTFT p99 | Output speed (p50) | Total latency (p95) |
|---|---|---|---|---|---|---|---|
tokenforge/glm-5.3 |
300 | 100% | 1.64 s | 2.51 s | 3.63 s | 82 tokens/s | 8.35 s |
tokenforge/glm-5.3 |
600 | 100% | 1.68 s | 2.53 s | 3.93 s | 82 tokens/s | 8.91 s |
tokenforge/glm-5.3 |
1,200 | 100% | 1.66 s | 4.91 s | 7.75 s | 81 tokens/s | 10.96 s |
tokenforge/glm-5.3 |
1,800 | 100% | 1.73 s | 6.03 s | 7.51 s | 82 tokens/s | 10.77 s |
tokenforge/glm-5.3 |
2,400 | 100% | 1.97 s | 6.27 s | 7.65 s | 76 tokens/s | 12.14 s |
tokenforge/glm-5.3 |
3,000 | 99.93% | 2.06 s | 5.96 s | 7.53 s | 70 tokens/s | 12.46 s |
tokenforge/glm-5.3 |
3,600 | 99.89% | 1.80 s | 4.10 s | 6.68 s | 73 tokens/s | 12.72 s |
tokenforge/glm-5.3 |
4,200 | 99.95% | 1.89 s | 5.62 s | 8.16 s | 73 tokens/s | 14.16 s |
tokenforge/glm-5.3-flash |
600 | 100% | 1.89 s | 4.57 s | 5.79 s | 40 tokens/s | 10.94 s |
tokenforge/glm-5.3-flash |
1,200 | 100% | 1.85 s | 4.34 s | 7.26 s | 40 tokens/s | 11.62 s |
tokenforge/glm-5.3-flash |
1,800 | 100% | 1.83 s | 4.67 s | 7.59 s | 40 tokens/s | 11.58 s |
tokenforge/glm-5.3-flash |
2,400 | 100% | 2.01 s | 5.29 s | 7.34 s | 40 tokens/s | 12.00 s |
To keep the table short it leaves out GLM 5.3's 900 and 1,500 RPM steps; both had 100% success, and both are in the charts.
Output Speed: How Fast the Answer Arrives
Time to first token tells you when the answer starts. Output speed tells you how long the rest of it takes.
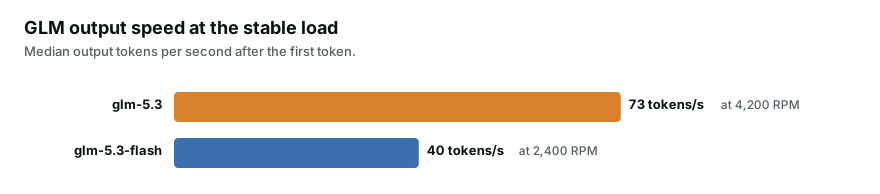
GLM 5.3 held 70–83 tokens per second at every step, and GLM 5.3 Flash 40 tokens per second, with no change under load. Flash is the lower-cost model in the GLM 5.3 family, not the faster one. Choose it for price on short, well-defined tasks, not for speed (why raw tokens per second is not the whole story).
Why the Smaller Model Reached Its Limit First
GLM 5.3 Flash topped out at a lower request rate than GLM 5.3, which surprises most people. The reason is the most useful idea in capacity planning: what runs out is the number of requests in flight at once, not the number of requests per minute.
A request holds its slot from the moment it is sent until the last token arrives. The number of slots in use is roughly:
requests in flight ≈ requests per second × seconds each request stays open
In this test, a GLM 5.3 answer averaged about 288 tokens at 73 tokens per second, about 3.9 seconds of streaming. A GLM 5.3 Flash answer averaged about 264 tokens at 40 tokens per second, about 6.6 seconds. Each Flash request held its slot about 1.7 times as long, and GLM 5.3's stable rate was 1.75 times Flash's (4,200 vs. 2,400 RPM). The two ratios match closely.
What this means for your traffic:
- Longer answers mean fewer requests per minute. If your answers are twice as long as the ~280 tokens in this test, plan on roughly half the request rate.
- Plan capacity in concurrent requests and tokens, not only RPM. A limit quoted in RPM only holds for the response length it was measured with (RPM, TPM and concurrency explained).
Pushing Past the Limit
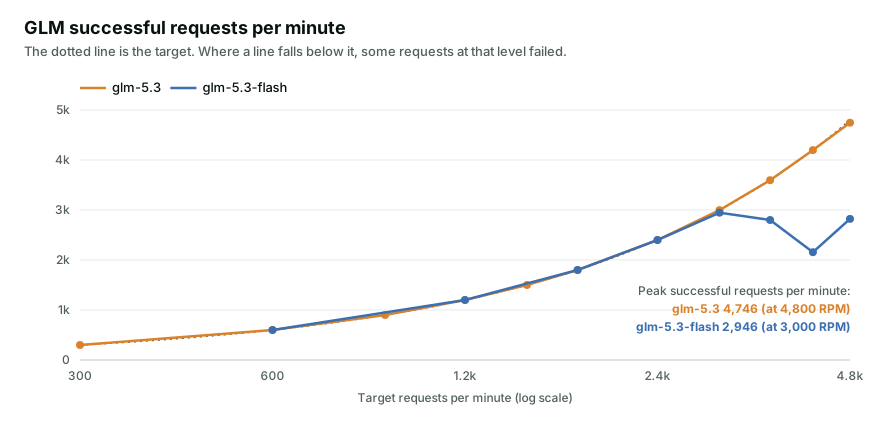
GLM 5.3 still completed 98.9% of requests at 4,800 RPM, or 4,746 successful requests per minute. GLM 5.3 Flash peaked at about 2,946 successful requests per minute at 3,000 RPM, and dropped to 51–78% success at 3,600 RPM and above.
How the models behaved at the edge is worth knowing. The first sign of the limit was latency, not errors. At the first overloaded step, GLM 5.3 still completed 98.9% of requests, but its p95 time to first token jumped from 5.62 to 14.82 seconds. GLM 5.3 Flash still completed 98.2%, but its p95 jumped from 5.29 to 32.16 seconds. Requests waited in a queue first; the ones that could not be served were then rejected with an error instead of hanging. Two practical consequences:
- Alert on p95 time to first token, not only on error rate. It moves first.
- Back off when requests are rejected instead of retrying immediately; immediate retries add load at exactly the moment there is none to spare (how to avoid a retry storm).
How It Compares With Providers on OpenRouter
OpenRouter publishes live latency statistics for every provider that serves a model. Here is our p95 time to first token next to several of them, including GLM's developer, Z.AI, for GLM 5.3 Flash.
| Model | Provider | Time to first token (p95) | Throughput (p50) |
|---|---|---|---|
tokenforge/glm-5.3 |
Token Forge Cloud | 5.62 s | 73 tok/s |
| Inceptron | 6.26 s | 89 tok/s | |
| Amazon Bedrock | 7.95 s | 114 tok/s | |
| SiliconFlow | 8.85 s | 52 tok/s | |
| Cloudflare | 9.26 s | 60 tok/s | |
tokenforge/glm-5.3-flash |
Token Forge Cloud | 5.29 s | 40 tok/s |
| DigitalOcean | 6.31 s | 99 tok/s | |
| DeepInfra | 8.98 s | 21 tok/s | |
| Novita | 9.79 s | 36 tok/s | |
| Z.AI | 11.52 s | 50 tok/s |
On both models, our p95 is 10% to 54% lower than the providers shown, measured at the highest stable load.
About this comparison: the OpenRouter figures are each provider's p95 latency and median throughput over the 30 minutes before we read them on openrouter.ai on November 16, 2026. Where a provider runs several endpoints for a model, we show its fastest. OpenRouter measures real traffic with prompts of many lengths. Our figures come from the controlled test described below, at the stable load. The conditions differ, so treat this as a directional comparison.
Compatible With the Official API
Capacity is only useful if the model behaves the way its documentation says. We checked the features production code depends on against each model's official behavior.
| Check | GLM 5.3 | GLM 5.3 Flash |
|---|---|---|
| Tool calls | Pass | Pass |
| JSON mode | Pass | Pass |
| Reasoning levels | low, high, max; always on, as official |
Same as GLM 5.3 |
Reasoning stays in max_tokens |
Pass | Pass |
| Prompt cache on a repeated prompt | 99.8% of ~21,000 tokens cached | 99.9% of ~21,000 tokens cached |
| Image input | Text only, as official | Base64 and https links |
Usage is reported in the OpenAI format: cached tokens in prompt_tokens_details.cached_tokens and reasoning tokens in completion_tokens_details.reasoning_tokens, so the cache savings show up on your bill and in your own logs.
How We Ran the Test
Clients. Four load-generating machines in the United States, sending in parallel.
Fixed schedule. Each request was sent at a pre-scheduled time, regardless of whether earlier requests had returned, so the offered load stayed constant even when responses slowed down.
No cache shortcuts. Every prompt was about 1,000 input tokens with a unique beginning, so no response could come from a prompt cache. Every response was streamed with max_tokens set to 300 and reasoning at low, the lowest setting GLM allows. Average output was about 288 tokens for GLM 5.3 and 264 for GLM 5.3 Flash, including reasoning.
Load steps.
- GLM 5.3: 300 to 1,800 RPM in 60-second steps, then 2,400 to 4,800 RPM in 30-second steps. A 60-second step at 2,100 RPM was interrupted by an account quota on the test setup, not by capacity, and is left out.
- GLM 5.3 Flash: 600 to 4,800 RPM in 30-second steps.
For 30-second steps, successful requests are doubled to give a per-minute figure. A series stopped when nine in ten or more requests in the last minute failed.
Metrics:
- Time to first token (TTFT): from sending the request to receiving the first token, counting reasoning tokens. Only successful requests are counted.
- Output speed: output tokens per second after the first token.
- Total latency: from sending the request to the end of the stream.
- Token throughput (TPM): input plus output tokens of successful requests per minute, from the average prompt and answer sizes above.
What These Results Cover
These numbers describe a specific workload, and we want you to know its limits:
- About 1,000 tokens in and up to 300 out. Longer answers hold each request open longer and lower the request rate, as explained above. Long agent loops do more work per request.
- Low reasoning. Higher reasoning effort generates more tokens and takes longer.
- Short steps. Steps lasted 30 to 60 seconds. These are step tests, not multi-hour runs, and limits that build up over longer periods would not show here.
If your traffic looks different, the method above is easy to reproduce with your own prompts. Create an account and test it with your own workload, or contact us if you need limits above the default.